
For better or for worse, 32 years after its initial release Microsoft Excel is still the most used program in business. In Excel’s defence, it has some advantages; Due to its longevity and prevalence, it is widely understood. Most computers have a program pre-installed that can open a spreadsheet prepared in Excel. But it has some clear limitations, Excel often relies on manual manipulation of data can not only be painful but can be downright dangerous. There’s an actual limit to how much data you can hold in a spreadsheet which is currently about 1 million rows and 16,000 columns which sounds like a lot, but in the world of big data, it isn’t, and if your project becomes larger or lasts longer than expected you’re creating your own personal Y2K bug. There are also issues with the time that it can take to interpret the formulas that someone else (or your past self) before you begin to work with a spreadsheet.
With the use of Pandas, the amount of data is only limited by the memory of the computer in use.

There are several alternatives, Static query languages SQL, BI tools such as Tableau, and programming languages like R or Python. For many, the idea of using a programming language is very daunting. However, it needn’t be; I’m going to go through 10 common Excel formulas and how they can be simply done with Python using the Pandas library.
There are also several options that are opened up through the use of a programming language such as iteration, the information can be manipulated more freely, and programming languages come with much greater versioning control.
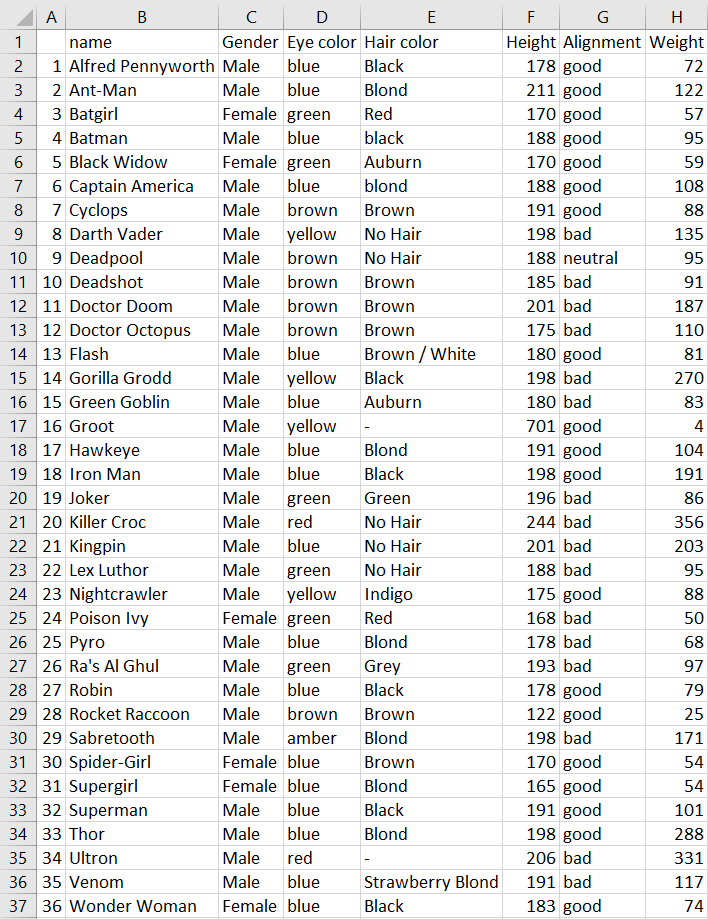
For this demonstration, we will be utilising some data on comic book characters and examining their physical attributes.
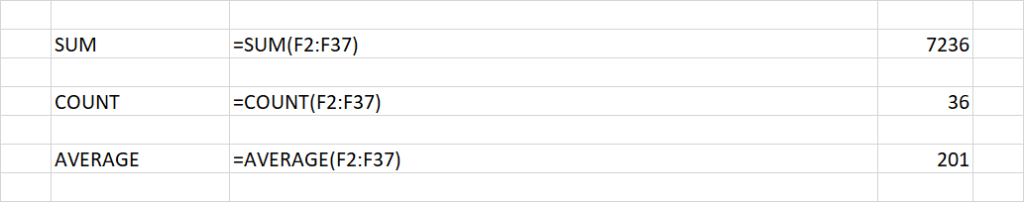
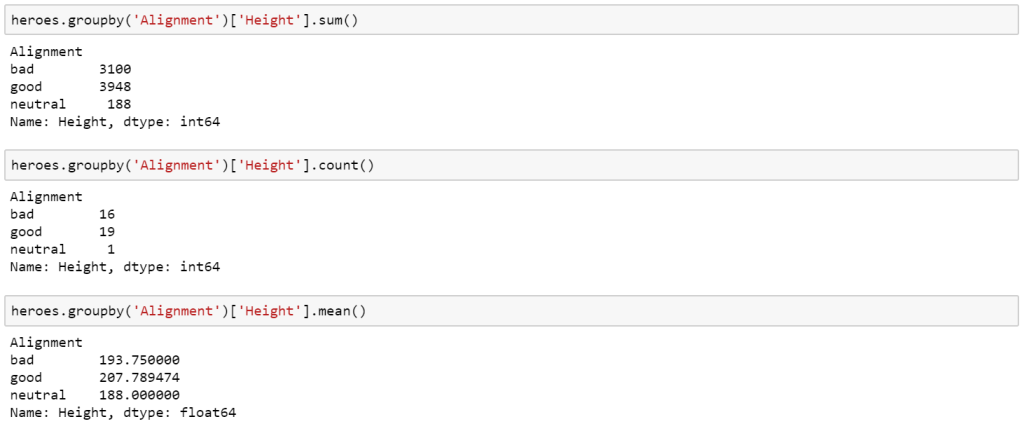
SUM, COUNT and AVERAGE
SUM, COUNT and AVERAGE are all self-explanatory and quick to implement in Excel.
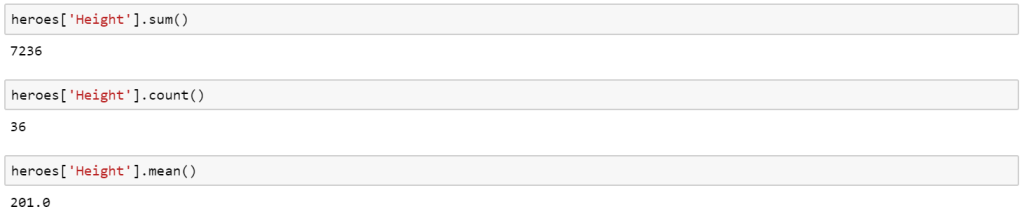
The great thing is that in Pandas, it is just as simple. The name of the data is called heroes and simply refer to the column by name, followed by the operation you’d like to perform. For more information see the Pandas documentation for SUM, COUNT and MEAN
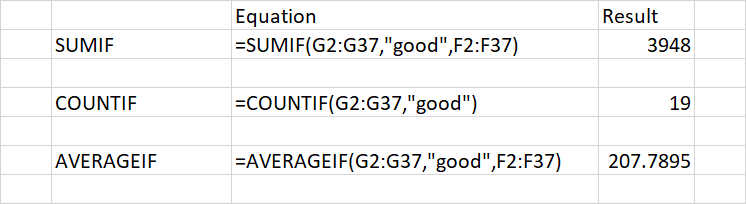
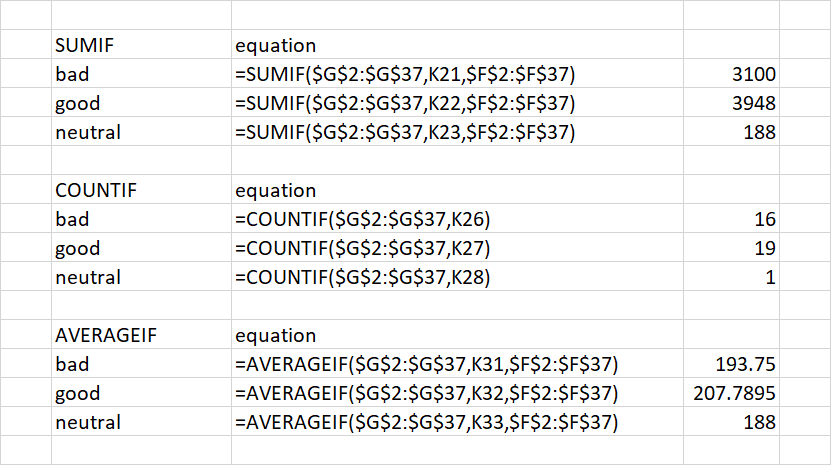
SUMIF, COUNTIF and AVERAGEIF
SUMIF, COUNTIF and AVERAGEIF are all an extension of the above functions where a condition is applied. Once again they are relatively simple to implement in both Excel and Pandas
However, one aspect I like about Pandas compared to Excel is that the columns automatically adopt their title row as a name and it makes the code more readable. To achieve this we use the loc operation.

Another nice thing is we can make it even simpler and do a summary using Groupby.
This would take a bit more work in Excel and would need to either type a new equation per scenario or write out a table for each.
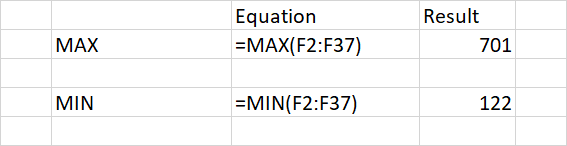
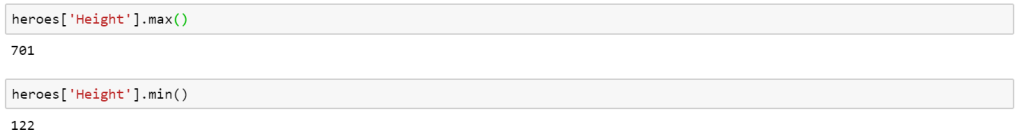
MAX and MIN
MAX and MIN are another one that is almost identical between the two options.
CONDITIONAL FORMATTING
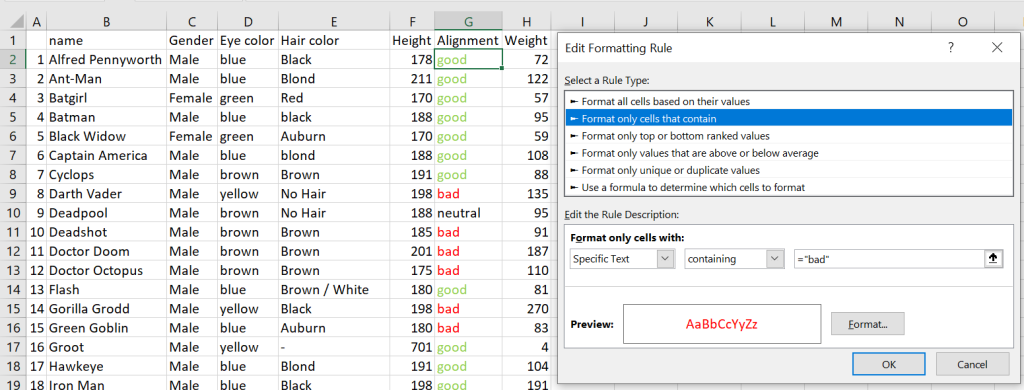
Conditional formatting can be a nice quick way of highlighting information in your table, whether it be by positive and negative values or by specific text like below. In Excel, you will implement a separate rule per formatting option.
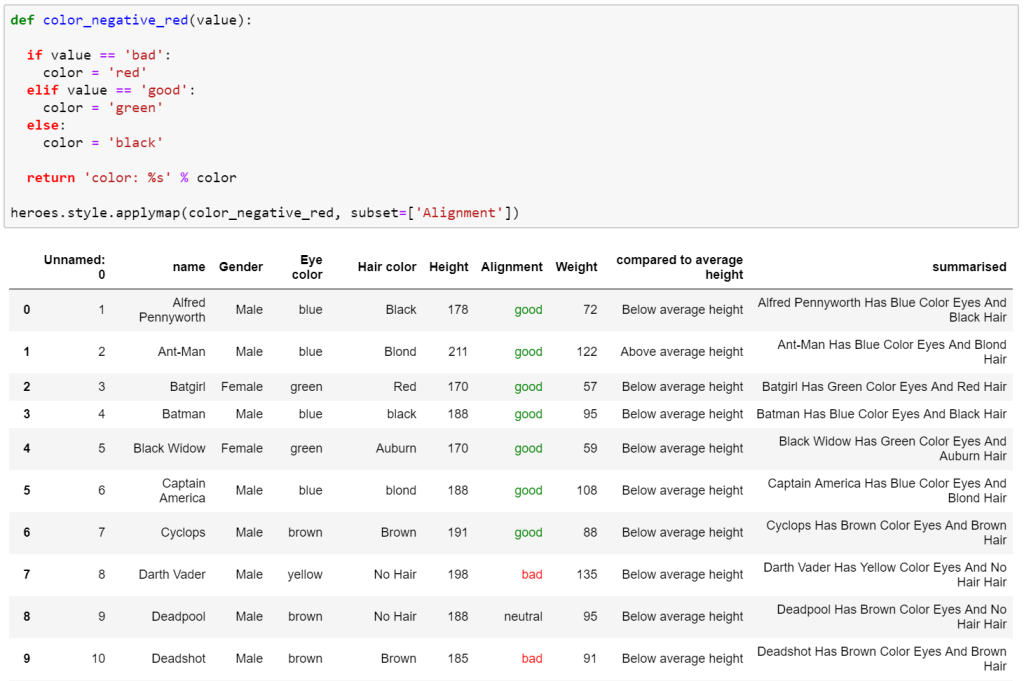
In Pandas it does involve implementing a function which can be a bit daunting the first time. However if you can write an IF statement in Excel, you can implement a quick function that will do this. The upside of this is that it is easy to read what is being done when you revisit the code at a later date.
IF Statements
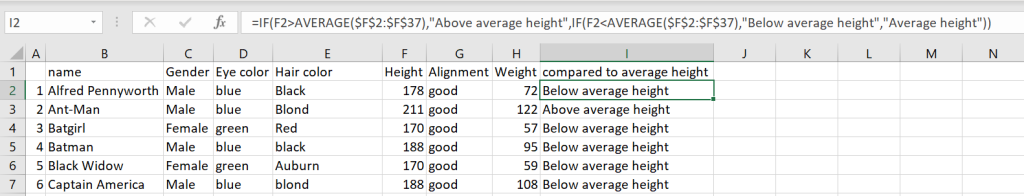
Speaking of IF statements, they can be powerful but they often need to be nested to take care of multiple conditions. Two IF statements nested can take a moment to absorb what it is trying to say. Once you go deeper than that and need to nest 3, 4 or more IF statements in one cell you create a cruel sort of hell when you need to decrypt what it’s trying to do, especially if the return value isn’t very self-explanatory. This is doing something very simple in returning if the ‘Height’ value is either above, below or the same as the average height.
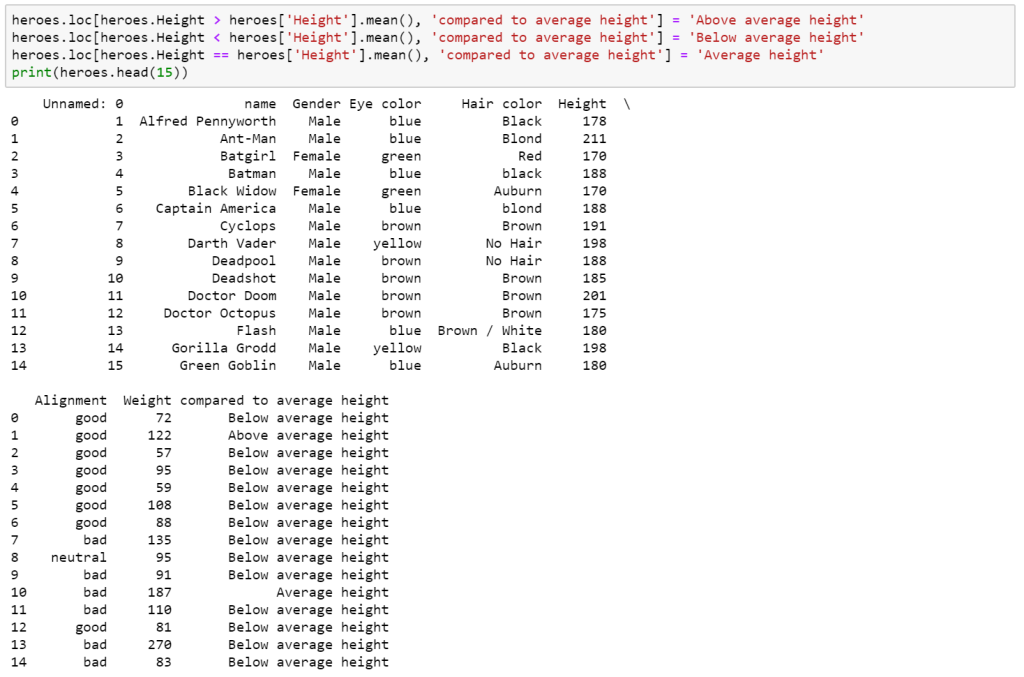
There are a few options in Pandas such as a function as per the Conditional Formatting however this is my personal favourite. It’s 3 distinct loc statements that are very easy to read later, the statements will also automatically add the new appropriate column to house the information.
Also a side note on IF statements in Excel, they slow the hell out of your spreadsheet when you have a number of them.
VLOOKUP
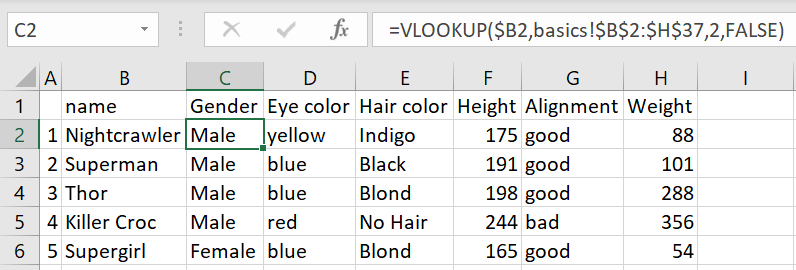
VLOOKUP is very handy to retrieve a piece of information from a specific row in a table. So in the below example, we have created a smaller list of heroes that we would like the information of, and then we are requesting the second column of our superheroes table. This can then be continued for the remaining columns if desired. It is good for a dynamic lookup for a small set of data but to be honest it can be cumbersome for a large set of data and you could be better off using Index and Match.
Pandas doesn’t have an exact equivalent to VLOOKUP, there are a few options but for this example, I have chosen MERGE. First, a table with the desired rows is created, naming the column with the lookup value the same as the original table, then simply merging the two and it will retrieve the rest of the columns. If you choose you can then use ‘loc’ to filter it to only the desired columns.

CONCATENATE
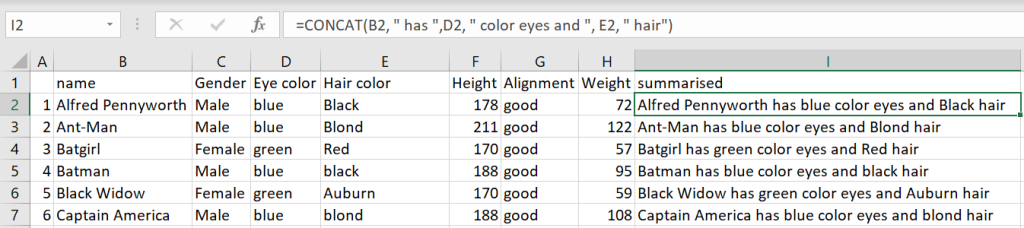
Concatenation is very useful for dynamic text values such as Titles that change with the appropriate date or based on values in the data. When you start to join several pieces of data it takes a moment to draw the dots of where it comes from, especially if you’re referring to other sheets or you’ve got some locked cells and some unlocked. while there is a “CONCATENATE” function in Excel it is advised to use the ‘&’ symbol or ‘ampersand’ as it’s called. CONCATENATE function has the disadvantage of a 255-character limit per string that is being joined which isn’t applied when using &, the other advantage is it is slightly quicker to type.
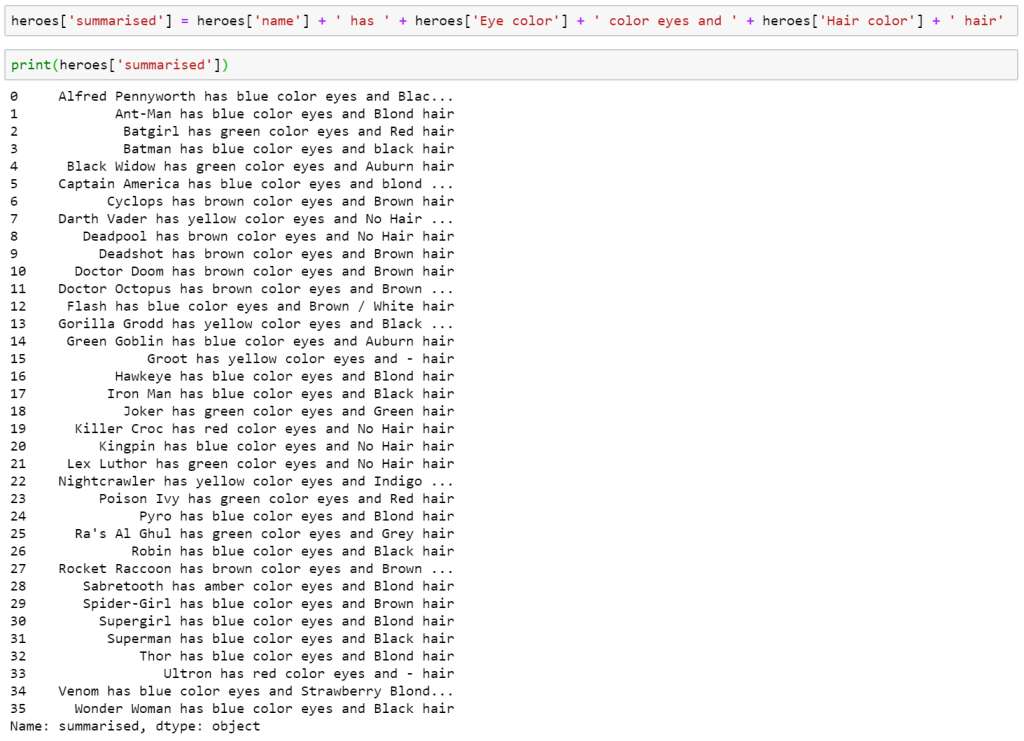
Similarly, Pandas simply uses a ‘+’ symbol in place of the ampersand of Excel.
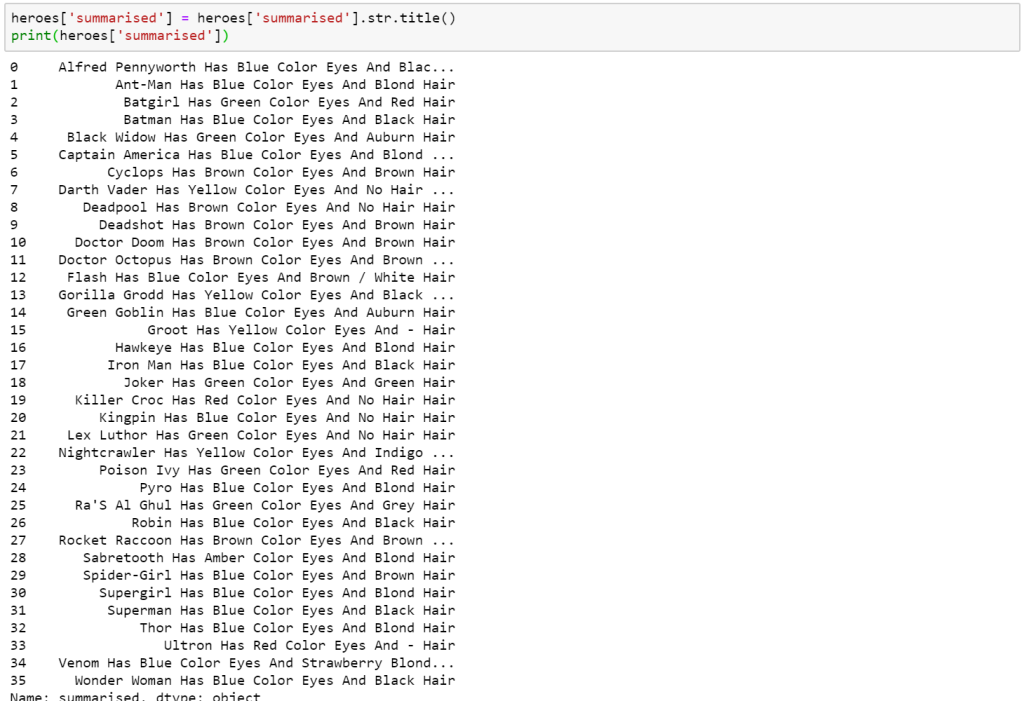
PROPER
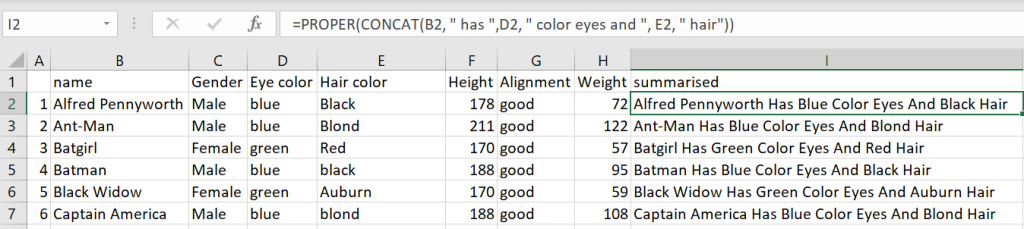
Now if you would like to capitalise the same thing, you simply wrap it in a PROPER equation.
To achieve the same in Pandas simply take the value, and apply .str.title() to it.
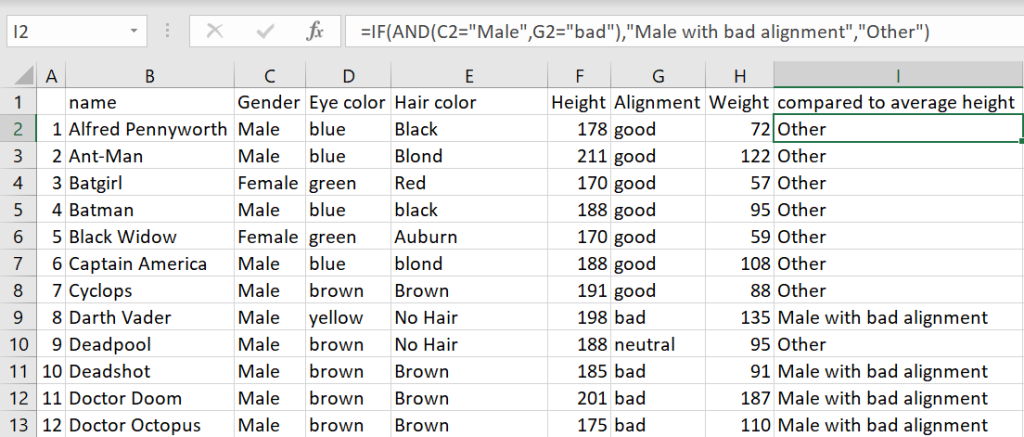
AND
AND function will return TRUE or FALSE based on two or more conditions. This is generally used within another operation such as a IF function. In the below example, we’re going to look for all males who are said to have a ‘bad’ alignment. It is similar to our IF function earlier but with the AND function as the test in order to test both of these attributes. This could then be filtered if desired.
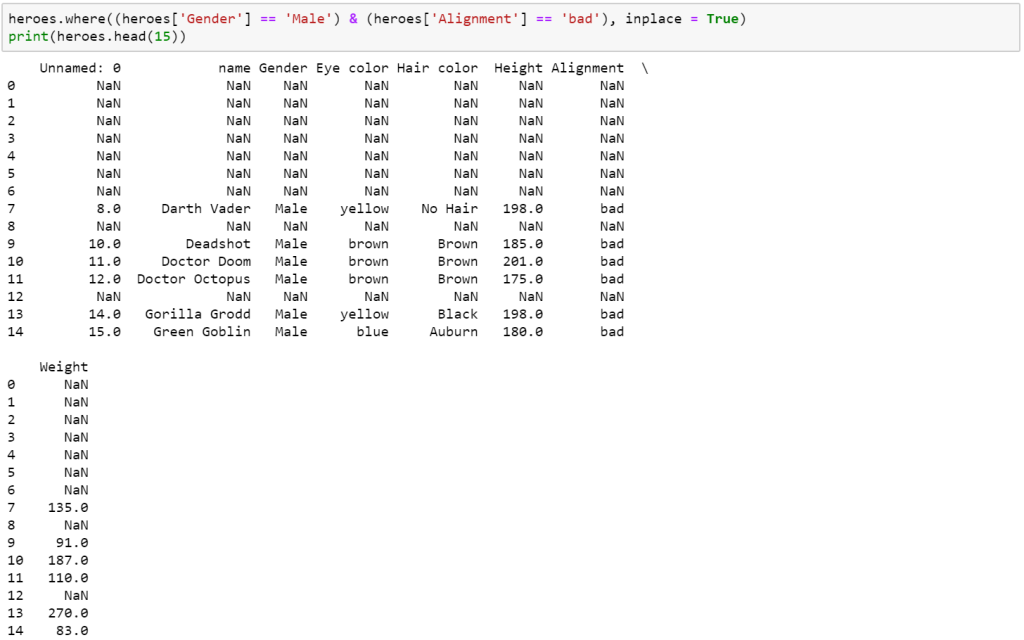
Similarly, we use a where function with the and function.
We can then filter out all other values by dropping the ‘NaN’ or empty rows.
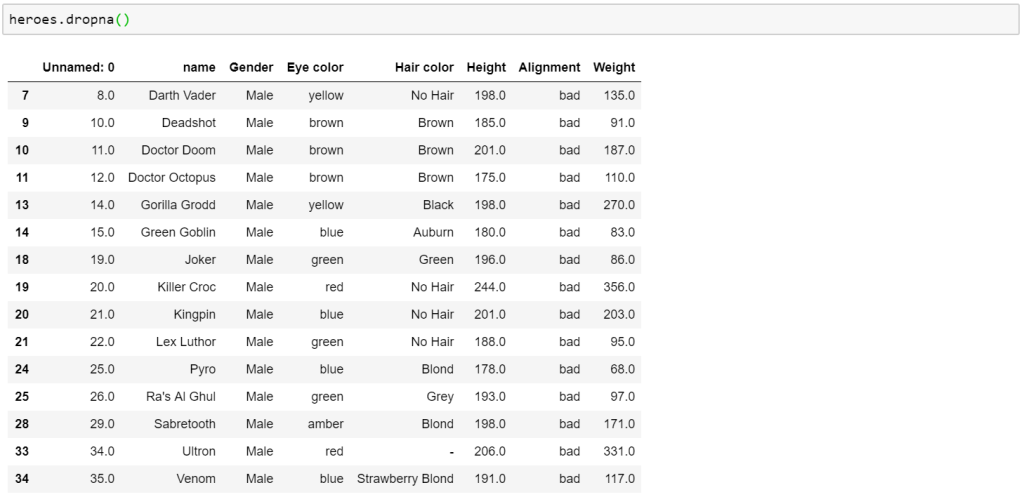
Alternatively, we could have had multiple IF statements as per the previous IF function. Another option would be to create a new table with the results of the operation so that the original table retains its original data.
INDEX and MATCH
Ok, I’ll admit that INDEX and MATCH always do my head in for a few minutes when I get halfway through and try and remember what I was trying to achieve in this mess. In this, we’re going to search the ‘name’ column and return the height.
INDEX returns the value within a table given their position say =INDEX(3,5) would give the 3rd row down on the 5th column. This is nice if you know the position of the position, this is where MATCH comes in. Given a value to search and either a column or row, MATCH will return the position of that value, if you search the row and the Title row for the desired column you have your full equation.
Here we’re trying to find the height of Batman.
This can get very dynamic by having a variable attached to either search which is why INDEX and MATCH combined are like Captain Planet. The result is a dynamic lookup function that is far more versatile than the alternatives.


This can be just as dynamic and attached to a loop or other forms of iteration to be able to return several values with a single equation, it’s also pretty readable using an at, loc and index function.

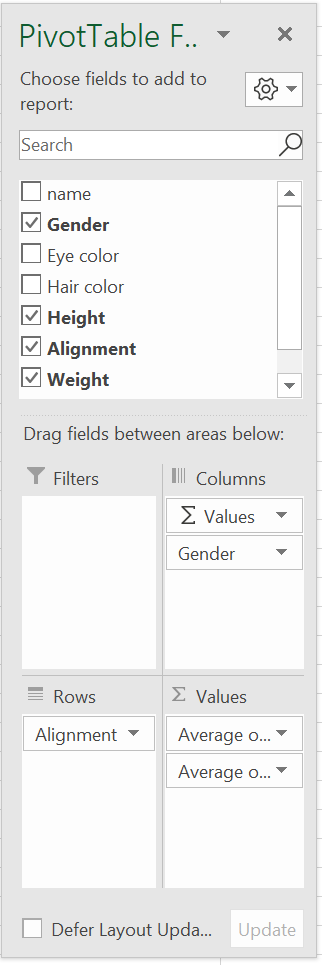
BONUS: PIVOT TABLE
I couldn’t resist including Pivot Tables in this article. It’s one of my most used features in Excel for quick analysis.
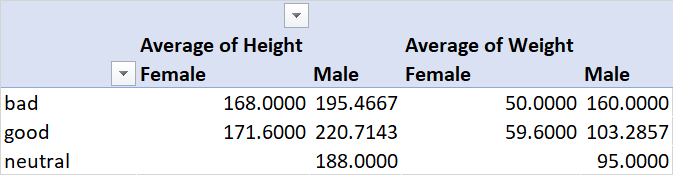
With a few clicks, you can get a nice table that will display the desired data
With a little more manipulation, you can get a pretty detailed drill-down into the data.
Here we are getting the average weight and height of both male and female characters based on their alignment.
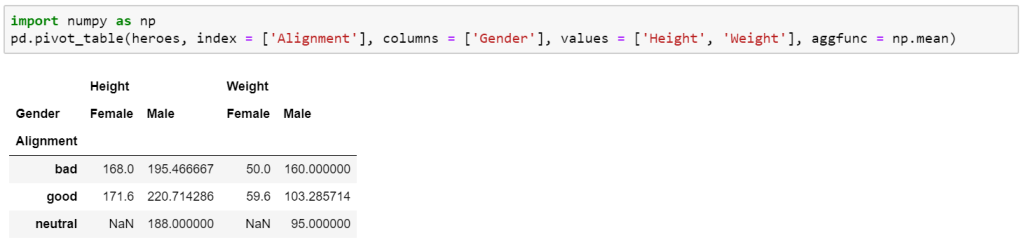
To accomplish the same Pivot Table in Pandas you do have to use Numpy which is another very powerful library in Python.
Here we want to examine the information in our ‘Heroes’ table, we want to sort it by their ‘Alignment’, and we want to have columns for each ‘Gender’ and we want columns for their ‘Height’ and ‘Weight’, finally we want to return the mean values.
For the code used in this blog please see my GitHub. If you would like any further explanation of anything discussed here please comment below.
Leave a Reply